Sapiens · Weight & Metabolic
BMI Calculator for India: Normal Range, Indian Cut-Offs and What BMI Misses
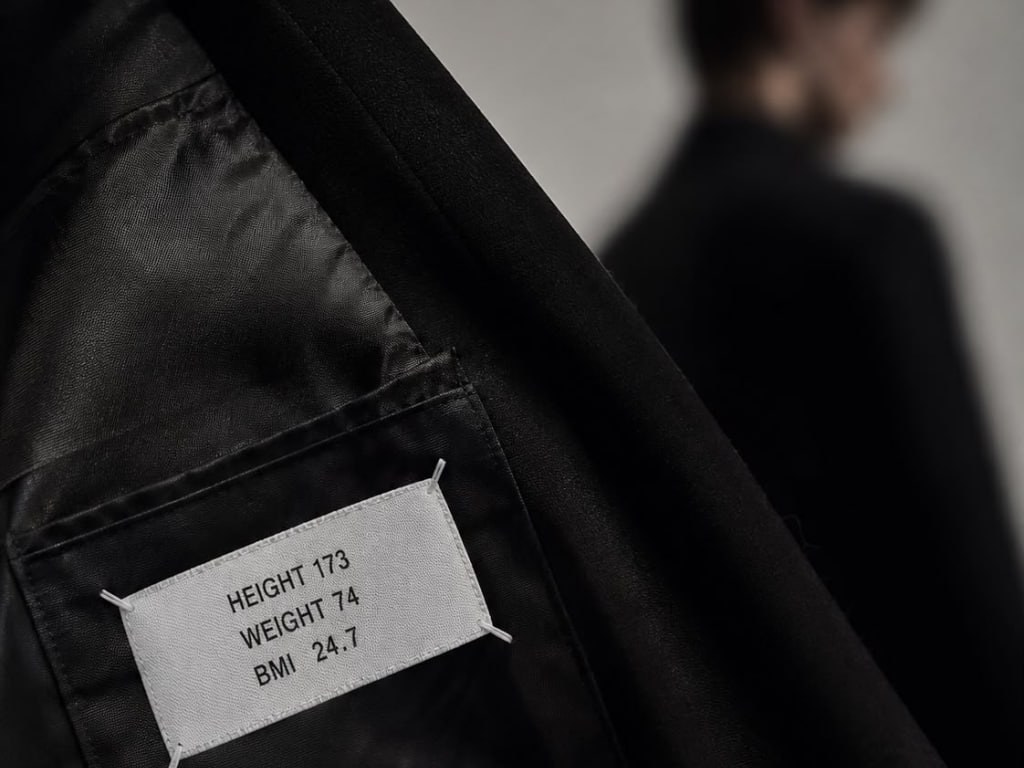
In the ICMR-INDIAB national survey, 43.3% of Indian adults fell into a single group: a BMI below 25, and two or more cardiometabolic risk factors. It was the largest of the four phenotypes the study measured, and the group's mean BMI was 21.4. Many of them fall squarely inside what a generic international BMI calculator calls normal. BMI is a useful number, and for an Indian body it is read on the wrong ruler by default. The calculator below uses the right one, and the rest of the page explains what the number can and cannot tell you.
Calculate your BMI on the Indian scale
Type your height and weight. Add your waist if you have a tape to hand; it supplies the piece of information BMI structurally lacks. The grade you see first is the 2025 Indian consensus grade, with the international reading beneath it so you can see exactly where the two charts part company.
Sapiens · BMI calculator
Your BMI, read on the Indian scale.
Body mass index is your weight divided by the square of your height. It is a screening number, and for Indian adults the lines that matter are drawn lower than the chart most apps use. Enter three numbers and the instrument shows your grade on both scales, the weight range that would put you in the normal band, and what your waist adds. Nothing you type leaves your browser.
Weigh yourself in the morning, after the bathroom, before breakfast, in light clothes. That is the number doctors compare across visits.
Stand, breathe out normally, and run the tape horizontally just above the hip bone, snug but not tight. Measured on skin where possible. The Indian cut-offs are 90 cm for men and 80 cm for women.
How to read what the instrument shows you
The arc is marked with the 2025 Indian consensus grades: normal 18.5–22.9, Grade I (overweight) 23–24.9, then Grades II, III and IV at 25, 27.6 and 32.5. Switch the scale to see the same number on the international chart, where overweight starts at 25 and obesity at 30. Neither chart is wrong; the Indian one is calibrated to the point where Indian diabetes and heart-risk data begin to climb.
Why the Indian lines are lower
At the same BMI an Indian body tends to carry more fat, less muscle, and more of that fat deep in the abdomen and liver. A Delhi body-composition study found the international threshold of 25 missed most people who were actually overfat, and national survey data show diabetes risk rising well below it. The cut-offs are drawn where that curve bends, and they apply equally to men and women.
Why the waist matters more than it looks
BMI cannot tell fat from muscle or say where fat sits. Waist circumference is the closest thing to a home reading of the deep abdominal fat that drives insulin resistance. Waist divided by height above 0.5, or a waist over the Indian cut-off, flags abdominal obesity even at a normal BMI, which is the most common metabolic pattern in India: 43% of adults in the ICMR-INDIAB survey had a BMI under 25 and two or more risk factors.
Who this calculator is not for
Anyone under 18, where BMI is read as a percentile against growth charts, and anyone pregnant: the adult grades do not apply to either. Interpret it cautiously in strength athletes with high muscle mass, and in older adults, especially where muscle loss or frailty is present, since body composition can change while the number does not.
What it decides, and what it does not
A BMI grade is a screening result. It does not diagnose obesity or metabolic disease, and it does not on its own qualify anyone for treatment; product labels and the Indian consensus both require a doctor to weigh your BMI with your waist, your blood results and your history. Where your number sits in a range the consensus flags for assessment, the instrument says so and points you to the next step. Where it does not, it says that too.
Grades: Misra et al., Diabetes Metab Syndr 2025;19:102989. Waist cut-offs: Misra 2006. Waist-to-height 0.5: Ashwell 2012. Phenotype prevalence: ICMR-INDIAB-23, Indian J Med Res 2025. Adults 18+, non-pregnant; interpret cautiously in older adults. Screening only; a doctor interprets it with your history. BMI grades are separate from the stages of obesity.
For Indian adults, the BMI normal range is 18.5–22.9 kg/m². BMI Grade I is 23–24.9, Grade II 25–27.5, Grade III 27.6–32.4 and Grade IV 32.5 or above. The international WHO chart uses 18.5–24.9 as normal and starts obesity at 30. BMI is a screening measure, so Indian guidance also considers waist circumference (90 cm in men, 80 cm in women) and waist-to-height ratio above 0.5.
What is BMI, and how is it calculated? Copy link
Body mass index is your weight in kilograms divided by the square of your height in metres. Someone who is 165 cm and 68 kg has a BMI of 68 ÷ (1.65 × 1.65), which is 25.0. The unit is kg/m², and the whole point of the calculation is to strip height out of weight, so that a tall person and a short person can be compared on one line.
The ratio is old. A Belgian statistician, Adolphe Quetelet, worked it out in the 1830s while describing the "average man" of a population. It was renamed the body mass index by Ancel Keys in 1972, and Keys was explicit that he was proposing it as a population measure and warned against reading it as a verdict on any one person.14 That caveat has survived fifty years of gym charts and insurance forms almost entirely intact, and it is still the single most useful thing to know about the number.
Does the formula even work for Indian bodies? It was built on European data, so the question is fair. A 2019 analysis of 43,880 Indian men, including 5,549 from tribal communities, found that weight does scale to roughly the square of height in this population, which means the arithmetic itself holds.7 What does not carry over from Europe is the meaning of the result. That is the subject of the rest of this page.
What is the normal BMI range in India? Copy link
For an Indian adult, the normal BMI band is 18.5 to 22.9. Under the 2009 BMI-only classification, 23 to 24.9 was labelled overweight and 25 or above obesity.2 The 2025 Indian consensus keeps those BMI grades and adds a separate staging system on top of them: stage 1 obesity can begin above a BMI of 23, while stage 2 depends on abdominal adiposity plus a health effect.1 So there are two things on this page that both use the word obesity, and they answer different questions. The international chart, which most calculators and apps still use, sets those lines at 25 and 30. So a BMI of 24 is "normal" on your phone and overweight in an Indian clinic, and both readings are following their own rules correctly.
| Category | Indian consensus (2009 / 2025) | International (WHO) |
|---|---|---|
| Underweight | below 18.5 | below 18.5 |
| Normal | 18.5 – 22.9 | 18.5 – 24.9 |
| BMI Grade I · overweight | 23.0 – 24.9 | 25.0 – 29.9 |
| BMI Grade II | 25.0 – 27.5 | 30.0 and above (classes I–III at 30, 35, 40) |
| BMI Grade III | 27.6 – 32.4 | |
| BMI Grade IV | 32.5 and above |
Three details people search for and rarely find answered plainly. First, the adult range is the same for men and women; sex changes how fat is distributed and how much of it a healthy body carries, but the BMI grades themselves do not split by sex in either system. Second, the WHO did not "change" the Asian cut-offs in 2004. Its expert consultation kept 25 and 30 as the international classification and added public-health action points at 23, 27.5, 32.5 and 37.5 for Asian populations, leaving each country to set its own lines.3 India chose 23 and 25. Third, the 2025 Indian document adds BMI grades above 25 (Grade II at 25 to 27.5, Grade III at 27.6 to 32.4, Grade IV at 32.5 and above) because the decisions a doctor makes, including about medicine and surgery, happen at those steps, well before 30.1 These BMI grades are separate from the stages of obesity described later on this page, and the two are easy to confuse: a grade describes your number, a stage describes whether the fat is already affecting your health.
Why are the BMI cut-offs lower for Indians? Copy link
Because at the same BMI, an Indian body tends to carry more fat, less muscle, and more of that fat deep in the abdomen and inside the liver. The pattern has a name in the literature, the thin-fat phenotype, and the evidence for it is Indian and goes back decades. A Delhi study published in 2001 measured body fat directly in 123 healthy volunteers and found that the international threshold of 25 had low sensitivity for picking out people who were actually overfat, worst of all in women; the BMI that best matched excess body fat came out at 21.5 for men and 19 for women.8 The authors called the numbers preliminary, and the sample was small, but larger Indian work since has pointed the same way, and that finding is the origin of the lower Indian lines.
The disease data point the same way. Using two national surveys, analysts found the probability of diabetes rising with BMI in Indians well before 25; the consensus authors cite an upturn at roughly 21.8, though that analysis is an economics working paper without clinical peer review, so treat the exact figure loosely.1 A peer-reviewed analysis of Indian survey data found that each extra unit of BMI raised the chance of diabetes about three times faster in people already overweight than in those who were not.15 Put those together and you have a curve that starts climbing in the "normal" international range and steepens after 25. The Indian cut-offs are drawn where the curve bends.
What does that mean for you, standing on a scale? If you are Indian and your BMI is 24, the plain reading is that you have crossed the line at which your population's diabetes risk is already rising, and that the tissue doing the damage is likely to be the fat you cannot see from outside. Nobody enjoys hearing that at a number the app calls fine, of course. It is also, by a wide margin, the most useful thing a BMI calculator can tell an Indian adult.
Can you have a normal BMI and still be unhealthy? Copy link
Yes, and in India that combination describes the single largest group of adults. The ICMR-INDIAB survey, a nationally representative study across 31 states, measured waist, blood pressure, fasting glucose, triglycerides and HDL in 19,370 adults and sorted them into four groups.5 Using a BMI cut of 25, the largest of the four groups, at 43.3 per cent, was people the study called metabolically obese non-obese: a BMI below 25, with two or more of those risk factors. Note the cut used. That group includes people at 23 or 24, whom the Indian scale already calls Grade I, alongside people in the normal band. Only 26.6 per cent were both non-obese and metabolically healthy. Only 1.8 per cent of the overall sample fell into the metabolically healthy obese phenotype; among participants with a BMI of 25 or more, roughly 6 per cent (352 of 5,830) were metabolically healthy by the study's definition. A high BMI in India is rarely harmless.
The mean BMI of that group was 21.4, which on either chart sits in the middle of normal. Their mean waist was 80 cm, their mean fasting glucose 109 mg/dL, their mean HDL 39. After adjusting for age, sex, activity, diet and family history, they were about seven times more likely to have type 2 diabetes than metabolically healthy people of the same BMI band, and they carried the highest risk of chronic kidney disease of any group, higher even than the obese-and-unwell group.5 More than a third of 20- to 29-year-olds already fitted the pattern.
Two cautions, because the number is striking enough to be misused. The survey is cross-sectional, so it shows association and cannot say which came first. And the metabolic screen relied on capillary glucose for diabetes diagnosis, which is noisier than venous plasma, although the investigators had previously validated the two against each other. Neither caution changes the practical conclusion the authors themselves drew: a normal BMI in India is not a clean bill of health, and the people most at risk of being missed are the ones who look, and weigh, fine.
What can BMI not tell you? Copy link
Four things, and each one has a real person attached to it.
What the weight is made of. A 172 cm man who lifts three times a week and a 172 cm man who has not exercised since college can both weigh 78 kg and share a BMI of 26.4. One is carrying muscle, the other visceral fat, and the formula cannot tell them apart. This is the athlete's complaint about BMI, and it is a fair one. Naturally, in a population where muscle mass runs low, it is also the less common way for the number to mislead.
Where the fat sits. Fat under the skin of the hips and thighs (gluteofemoral subcutaneous fat) is generally less metabolically harmful than the fat around the organs. Fat packed around the intestines and inside the liver is not; it is the tissue most tightly linked to insulin resistance and fatty liver in Indians.1 Two people with an identical BMI can differ enormously here, and only a tape measure or a scan will show it.
Age. From the mid-fifties onward, people tend to lose muscle and gain fat while their weight stays roughly level. BMI does not move, body composition has. A "stable" BMI of 24 at 65 can hide a body that is considerably fatter than it was at 40.1
Whether you will actually be harmed. A prospective cohort of 500,810 adults in Chennai, most of them aged 35 to 69, found BMI little related to death from heart disease or stroke, with only small excesses at the extremes of the range, and the investigators drew attention to how unexpectedly weak the link between higher BMI and vascular death was in this population.9 BMI tracked blood pressure and diabetes far better than it predicted mortality. The finding is from one urban south Indian population and may not read the same everywhere in the country, but it is a good reason to let a single number open the conversation and not close it.
What is better than BMI? Copy link
Nothing replaces it outright, because nothing else is free, instant and reproducible across a whole country. But two measurements fill its blind spot, and one of them takes ten seconds.
Waist circumference
For Asian Indians, abdominal obesity is a waist of 90 cm or more in men and 80 cm or more in women, thresholds derived from north Indian data on where cardiovascular risk factors cluster.11 Measure standing, tape horizontal, just above the hip bone, at the end of a normal breath out, and in a fasting state if you want to compare it month to month. Across 72 prospective cohorts and more than 2.5 million people, each 10 cm of extra waist was associated with roughly 11 per cent higher all-cause mortality, independent of BMI.13 Your waist is not a vanity measure. It is the closest thing you have at home to a visceral-fat reading.
Waist-to-height ratio
Divide your waist by your height, both in centimetres, and aim to stay under 0.5. The rule of thumb is "keep your waist under half your height." A systematic review of studies covering more than 300,000 people found the ratio discriminated cardiometabolic risk better than either BMI or waist alone, and that the 0.5 cut-off worked across sexes and ethnic groups.10 The 2025 Indian consensus recommends it over the older waist-to-hip ratio, partly because measuring the hip is awkward in clinic and the ratio is hard to interpret when both numbers change together.1
Body fat percentage
Body fat is the thing BMI is standing in for, so measuring it directly is better in principle. The Indian thresholds for obesity are above 25.5 per cent in men and above 38 per cent in women.12 In practice, the bathroom scales and gym machines that estimate it use bioelectrical impedance, which drifts with hydration, the time of day and what you last ate, and their equations were mostly calibrated on non-Indian bodies. Treat a home reading as a trend line you own, and nothing more. The consensus calls body fat the gold standard and then, in the next line, says its measurement is optional because the equipment is neither available nor affordable in most Indian settings. That is an accurate description of the situation.
| Measure | What it captures | Indian action point | Weakness |
|---|---|---|---|
| BMI | Weight for height | ≥ 23 overweight · ≥ 25 obese | Blind to composition and fat location |
| Waist | Abdominal (visceral) fat | ≥ 90 cm men · ≥ 80 cm women | Technique-sensitive; unreliable above BMI 35 |
| Waist ÷ height | Abdominal fat scaled to frame | > 0.5 | Same measurement error as waist |
| Body fat % | Actual adiposity | > 25.5% men · > 38% women | Home devices imprecise; lab methods costly |
What are stage 1 and stage 2 obesity in the 2025 Indian definition? Copy link
Before this section makes sense, one distinction has to be clear, because it is the part the 2025 framework most often loses in translation. A BMI grade (I to IV) is a band on the scale, nothing more. A stage of obesity says whether that extra fat is doing anything to you. Someone can sit at Grade III on the number and be stage 1; someone at Grade I can be stage 2. The January 2025 consensus did what the 2009 version did not: it separated having extra fat from being harmed by it. Stage 1 obesity is a BMI above 23 with normal blood sugar, blood pressure and lipids, no heart disease, and no symptoms in daily life. Stage 2 obesity needs a BMI above 23 plus a raised waist or waist-to-height ratio, and then either symptoms that limit day-to-day activity or an obesity-linked condition already present.1
The symptoms they mean are specific: breathlessness or palpitations on ordinary exertion, knee or hip pain that limits walking or climbing stairs, and depression or anxiety arising from the physical state. The conditions on the list include type 2 diabetes, hypertension, dyslipidaemia, fatty liver, obstructive sleep apnoea, osteoarthritis of the knees or spine, PCOS, infertility, low testosterone in men, and leg swelling. If your BMI is 26 and none of these apply, you have stage 1 obesity with a BMI of Grade II, and the recommended response is diet, activity and behaviour change with the explicit aim of never reaching stage 2. Stage 2 is not reached by a comorbidity alone. It requires the abdominal-adiposity criterion as well: a BMI above 23 plus a waist of 90 cm or more in men, or 80 cm or more in women, or a waist-to-height ratio above 0.5, and then at least one qualifying functional limitation or obesity-related condition. Where all of that is present, the recommendation changes to early treatment.
The idea runs in parallel with the Lancet Commission on clinical obesity, published the same month, which drew the same line between preclinical and clinical obesity worldwide; the Indian document's lead author sat on that commission.6 Both are consensus statements, built from expert agreement, with no trial behind the thresholds, and the Indian authors list the weaknesses of their own Delphi process in the paper, including the loss of panellists who dropped out after the first round. What the staging does, for you, is turn "am I obese?" into a better question: "is my extra fat already doing something?"
At what BMI is weight-loss treatment considered in India? Copy link
Lower than most people assume, and the number on its own is never the whole criterion. In the 2025 Indian consensus, medicine becomes an option in stage 1 obesity when someone is at high risk of progressing (a strong family history of diabetes or heart disease is the example given), when weight has risen more than 10 per cent despite a proper attempt at lifestyle change, or when BMI reaches 27.5. In stage 2 obesity, where a related condition is already present, the advice is to start pharmacotherapy early.1 Bariatric surgery is considered from a BMI of 35 regardless of complications, from 30 with complications that have not responded to treatment, and from 27.5 in people with type 2 diabetes that stays uncontrolled.
That framework was joined on 3 August 2026 by the first joint position statement of the Obesity and Metabolic Surgery Society of India and the Endocrine Society of India, published in Obesity Surgery: 78 specialists, a modified Delphi process with consensus set at 80 per cent agreement, and 55 recommendations running from diagnosis through lifestyle therapy, obesity medicines, surgery and long-term follow-up.16 Its direction of travel matters for how your BMI gets used. It treats obesity as a chronic, relapsing disease, moves away from a rigid treatment ladder toward care personalised to disease severity and metabolic risk, and anchors its thresholds to Indian BMI and waist values rather than Western ones. It does not replace the 2025 grades and stages on this page; it tells doctors what to do once those have been assessed.
The prescription weight-management medicines licensed in India carry their own thresholds on the label, which broadly follow the international lines: a BMI of 30, or 27 with at least one weight-related condition. So a doctor in India is working with two overlapping sets of numbers, and which one governs depends on the specific medicine, your metabolic results, and your history. That is exactly why the question "am I eligible?" cannot be answered by a calculator, and why the eligibility question turns on the conditions rather than the number.
What can be said from this page is narrower and still useful. A BMI of 25 to 27.5 does not by itself put you in line for medicine, whatever a waist measurement adds; the framework asks for your metabolic results, your symptoms and how your weight has moved over time, and it names 27.5 as the number at which pharmacotherapy can be considered in stage 1 obesity. Where abdominal obesity is also present, an obesity-related condition or a qualifying functional limitation moves the framework to stage 2, and the advice changes with it. If your BMI is 23 to 24.9, the consensus wants labs and a waist measurement before anyone decides anything. The full picture of what Indian treatment involves, what it costs, and who it suits sits in our pillar on weight loss treatment in India.
If your number landed in a range worth assessing, the next step is a doctor.
Sapiens is opening a doctor-led weight and metabolic programme in India: blood tests first, a clinical read of your BMI, waist and results together, and a plan you can keep. Whether medicine is appropriate depends on your metabolic health, symptoms, history and the specific medicine's approved indication. Join the waitlist and you will be among the first to be seen.
Join the weight-loss plan waitlistBrowse the Sapiens journalWhat does an Indian doctor actually do with your BMI? Copy link
Treats it as the first line on a form, then measures the things it cannot. The workup the 2025 consensus lays out is a good picture of what a competent assessment looks like, and of how little of it is the BMI itself.1
- On the examination couch: height, weight and BMI; waist, and from it waist-to-height ratio; blood pressure; a look at the neck and armpits for acanthosis nigricans, the dark velvety thickening that signals insulin resistance and was found in 16 per cent of a south Indian community sample; skin tags; and the abdomen for an enlarged liver.
- In the blood: a glucose tolerance test or fasting glucose with HbA1c; a fasting lipid profile, where an Indian pattern of high triglycerides and low HDL is the common finding; liver enzymes for fatty liver; thyroid function; urea and creatinine; uric acid.
- Where indicated: an abdominal ultrasound for liver fat and, in women, ovarian volume; a FIB-4 score from the liver tests to gauge fibrosis risk; a sleep study if snoring and daytime sleepiness suggest apnoea.
Notice the order. As you would expect, BMI opens the file. The blood decides what is in it. This is also the practical answer to the person whose BMI is 22 and whose waist is 92: the calculator cannot help you further, but a fasting panel can, and in India that is a home-collection away. If you want one starting point, a full body checkup that includes HbA1c, lipids, liver and thyroid covers the metabolic screen this page keeps pointing at.
How do you lower your BMI safely? Copy link
Since BMI is weight divided by a height that will not change, lowering it is losing weight, and the relevant question is what kind of weight. A loss of 5 to 10 per cent of body weight, held, is the amount the consensus and the diabetes prevention trials treat as clinically meaningful; it substantially cuts the odds of prediabetes becoming diabetes and lowers blood pressure.1 At a safe pace of half a kilo to a kilo a week, that is three to six months of work for most people. The consensus also tells patients two things up front that deserve repeating: a plateau is expected after the first months, and weight tends to return when diet, exercise or medicine stop.
The lean tissue you lose alongside fat is the part to protect, which is why every Indian guideline pairs the calorie deficit with more protein and resistance training at least three days a week; Indian diets are often protein-light to begin with, so this is not a bodybuilder's concern. For a BMI-specific target, you could aim your first goal at the next line down: from grade II to grade I, or from grade I to under 23, and measure your waist as you go, because it will often move before the scale does.
Who is this number not for? Copy link
Four groups, and the calculator above will mislead all of them.
Children and teenagers. Under 18, BMI is read as a percentile against age- and sex-specific growth charts, and the fixed adult numbers do not apply; a BMI of 22 means something different at 12 and at 16. Indian paediatric practice uses Indian Academy of Pediatrics growth references, and the adult cut-offs on this page do not apply.
Pregnancy. Weight gain is expected and is managed against pre-pregnancy BMI. The current reading has no meaning on this chart.
People with a lot of muscle. Serious strength athletes and some manual workers carry enough lean mass to push BMI into "overweight" with low body fat. A waist measurement and, if you can get it, a body-fat reading will resolve it.
Older adults. Above 65 or so, the muscle-loss problem described earlier makes BMI unreliable in both directions, and some Indian and international data suggest that a slightly higher BMI is protective in this age group. A doctor will weigh strength, walking speed and appetite alongside the number.
Questions people ask about BMI in India Copy link
What is a healthy BMI for Indians?
18.5 to 22.9 kg/m². The Indian consensus, first published in 2009 and restated in 2025, sets overweight at 23 to 24.9 and obesity at 25 and above, five points below the international line of 30. The same adult range applies to men and women.
Is a BMI of 23 overweight in India?
Yes. On the Indian scale, 23 is the start of overweight (grade I). On the international chart it is still normal. Indian diabetes risk is already rising at this point, which is why the consensus asks for a waist measurement and a fasting blood panel at this point.
What does a BMI of 27 or 28 mean for an Indian adult?
BMI Grade II on the Indian scale at 27, and Grade III from 27.6, whereas the international chart calls both overweight. A BMI of 27.5 is also one of the points at which the Indian consensus says medicine may be considered even without a related condition. Whether it should be considered depends on your waist, your blood results and your history, and the number alone decides nothing.
Is a BMI of 22 good?
It sits in the Indian normal range, so on BMI alone, yes. In the ICMR-INDIAB survey, though, the largest group of adults, 43.3 per cent, had a BMI below 25 with two or more cardiometabolic risk factors, and that group's mean BMI was 21.4. A BMI of 22 with a waist under the cut-off and normal fasting bloods is good. A BMI of 22 on its own is unread.
Is BMI calculated differently for men and women?
No. The formula, weight in kilograms divided by height in metres squared, is identical, and so are the adult cut-offs in both the Indian and international systems. Sex matters for the waist thresholds (90 cm for men, 80 cm for women) and for body-fat thresholds (25.5 per cent for men, 38 per cent for women), because women carry more fat at any healthy weight.
Is BMI accurate?
It is accurate as a population screen and rough for an individual. It cannot separate muscle from fat, cannot locate fat, and drifts with age. In a cohort of half a million Indian adults it tracked blood pressure well but had little association with cardiovascular death. Read it with a waist measurement and, where risk is present, a blood panel.
What is better than BMI?
For a quick home reading, waist-to-height ratio: keep your waist under half your height. Waist circumference against the Indian cut-offs of 90 cm (men) and 80 cm (women) is equally useful. Body-fat percentage is better in principle but hard to measure accurately outside a lab. None of these replaces a fasting metabolic panel if your risk is raised.
What BMI do you need for weight-loss injections in India?
Product labels in India broadly follow the international thresholds of a BMI of 30, or 27 with a weight-related condition, while the 2025 Indian consensus allows pharmacotherapy from 27.5 or earlier in people at high risk or with a related condition. A doctor decides which framework applies to you and whether treatment is suitable at all; the conditions and contraindications matter more than the number.
What is the full form of BMI?
Body Mass Index. The term was coined by Ancel Keys in 1972 for a ratio first described by Adolphe Quetelet in the 1830s.
References Copy link
- Misra A, Vikram NK, Ghosh A, Ranjan P, Gulati S; India Obesity Commission Members. Revised definition of obesity in Asian Indians living in India. Diabetes Metab Syndr. 2025;19(1):102989. doi:10.1016/j.dsx.2024.102989
- Misra A, Chowbey P, Makkar BM, et al. Consensus statement for diagnosis of obesity, abdominal obesity and the metabolic syndrome for Asian Indians and recommendations for physical activity, medical and surgical management. J Assoc Physicians India. 2009;57:163-170. PMID 19582986
- WHO Expert Consultation. Appropriate body-mass index for Asian populations and its implications for policy and intervention strategies. Lancet. 2004;363(9403):157-163. doi:10.1016/S0140-6736(03)15268-3
- Anjana RM, Unnikrishnan R, Deepa M, et al. Metabolic non-communicable disease health report of India: the ICMR-INDIAB national cross-sectional study (ICMR-INDIAB-17). Lancet Diabetes Endocrinol. 2023;11(7):474-489. doi:10.1016/S2213-8587(23)00119-5
- Deepa M, Pradeepa R, Venkatesan U, et al. High prevalence of metabolic obesity in India: The ICMR-INDIAB national study (ICMR-INDIAB-23). Indian J Med Res. 2025;161(5):461-472. doi:10.25259/IJMR_328_2025
- Rubino F, Cummings DE, Eckel RH, et al. Definition and diagnostic criteria of clinical obesity. Lancet Diabetes Endocrinol. 2025;13(3):221-262. doi:10.1016/S2213-8587(24)00316-4
- Hood K, Ashcraft J, Watts K, et al. Allometric scaling of weight to height and resulting body mass index thresholds in two Asian populations. Nutr Diabetes. 2019;9(1):2. doi:10.1038/s41387-018-0068-3
- Dudeja V, Misra A, Pandey RM, Devina G, Kumar G, Vikram NK. BMI does not accurately predict overweight in Asian Indians in northern India. Br J Nutr. 2001;86(1):105-112. doi:10.1079/bjn2001382
- Gajalakshmi V, Lacey B, Kanimozhi V, Sherliker P, Peto R, Lewington S. Body-mass index, blood pressure, and cause-specific mortality in India: a prospective cohort study of 500 810 adults. Lancet Glob Health. 2018;6(7):e787-e794. doi:10.1016/S2214-109X(18)30267-5
- Ashwell M, Gunn P, Gibson S. Waist-to-height ratio is a better screening tool than waist circumference and BMI for adult cardiometabolic risk factors: systematic review and meta-analysis. Obes Rev. 2012;13(3):275-286. doi:10.1111/j.1467-789X.2011.00952.x
- Misra A, Vikram NK, Gupta R, Pandey RM, Wasir JS, Gupta VP. Waist circumference cutoff points and action levels for Asian Indians for identification of abdominal obesity. Int J Obes (Lond). 2006;30(1):106-111. doi:10.1038/sj.ijo.0803111
- Joseph L, Wasir JS, Misra A, et al. Appropriate values of adiposity and lean body mass indices to detect cardiovascular risk factors in Asian Indians. Diabetes Technol Ther. 2011;13(9):899-906. doi:10.1089/dia.2011.0014
- Jayedi A, Soltani S, Zargar MS, Khan TA, Shab-Bidar S. Central fatness and risk of all cause mortality: systematic review and dose-response meta-analysis of 72 prospective cohort studies. BMJ. 2020;370:m3324. doi:10.1136/bmj.m3324
- Keys A, Fidanza F, Karvonen MJ, Kimura N, Taylor HL. Indices of relative weight and obesity. J Chronic Dis. 1972;25(6):329-343. doi:10.1016/0021-9681(72)90027-6
- Gupta S, Bansal S. Does a rise in BMI cause an increased risk of diabetes?: Evidence from India. PLoS One. 2020;15(4):e0229716. doi:10.1371/journal.pone.0229716
- Obesity and Metabolic Surgery Society of India; Endocrine Society of India. Expert Consensus on Obesity Management Protocols – A Joint Position Statement by OSSI and ESI. Obes Surg. Published online 3 August 2026.
This article and the calculator on it are for information and education. BMI is a screening measure and not a diagnosis; the grades shown apply to non-pregnant adults aged 18 and over. Consultations on Sapiens are provided by registered medical practitioners under the Telemedicine Practice Guidelines 2020, and prescription treatments are dispensed only against a valid prescription. Nothing here replaces a consultation with a doctor who knows your history. To report an error, write to editorial@joinsapiens.in.